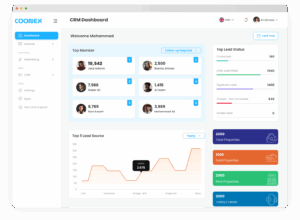
The Coonex Dashboard is your real-time control center.
It gives you a complete snapshot of your company’s performance — from sales activity and lead sources to agent productivity and campaign results — all in one screen.
1. Overview #
The dashboard aggregates live data from all system modules (CRM, Tasks, Projects, Ads, and Reports) to give managers and agents instant visibility into their performance.
Key Highlights:
- View total leads, properties, and revenue at a glance.
- Monitor top-performing agents.
- Track daily tasks and sales progress.
- Analyze lead sources and conversion trends.
2. Top Members Widget #
This section displays the top-performing team members based on:
- Closed Deals
- Contacts Handled
- Calls Made
- Revenue Generated
Each member card shows:
- Profile name and role.
- Number of deals closed.
- Total calls or client contacts.
- Current sales revenue (linked to CRM deals).
Tip: Managers can use this widget to recognize high performers and track workload balance across the sales team.
3. Sales Revenue Overview #
Displays your total revenue performance over time — helping you measure business growth and identify top-selling months.
4. Leads Source Data #
Shows where your leads are coming from — giving you a clear picture of which platforms drive the best results.
Insight: The system updates these metrics in real time as new leads sync from active Coonex campaigns.
5. Top Lead Status (Last 30 Days) #
Visual chart summarizing the current state of all leads in your CRM.
Each status (e.g., New, Contacted, Negotiation, Offer Submitted, Closed) shows total count and percentage.
Why It Matters:
You can identify pipeline bottlenecks — for example, if many leads remain “New” or “No Response,” your team may need faster follow-ups.
6. Properties Summary #
This widget shows property-level insights directly linked to your CRM listings.
7. Today’s Activities #
Displays the latest actions recorded by your team — including calls, meetings, or follow-ups.
“No data until now”
Once agents log activity (e.g., “Call made” or “Meeting completed”), this section updates automatically.
8. Tasks Overview #
Pie chart displaying the current distribution of tasks by status:
- To Do
- In Progress
- Review
- Done
Each category shows a percentage value to visualize completion progress.
Use Case: Managers can instantly identify pending work and agents who may need assistance closing tasks.
9. One-Click WhatsApp Integration #
From the dashboard, you can directly contact your clients via WhatsApp.
Clicking the WhatsApp icon beside a lead opens the chat instantly — no need to copy or save numbers.
This helps your sales team follow up instantly from the dashboard itself.
10. Data Privacy & Masking #
Sensitive data — such as client phone numbers or emails — is protected under the same hover-to-reveal privacy system used in CRM.
Even on the dashboard, these details are partially masked to prevent screenshots or unauthorized copying.
Only users with the right access level (Admin / Manager) can view full data.
11. Real-Time Campaign Sync #
The dashboard automatically updates whenever new leads enter from:
- Meta Ads (Facebook / Instagram)
- TikTok Ads
- Google Search Campaigns
- Coonex AI Lead Generation Forms
No manual refresh is required — every new lead or conversion appears instantly, fully tagged by campaign source.
12. Best Practices #
- Review the dashboard daily for quick performance insights.
- Use Lead Source Data to decide which channels to scale.
- Monitor Task Progress weekly for operational control.
- Verify Top Members every month to identify star performers.
- Keep all data synced by ensuring ad accounts stay connected in settings.